Understanding elements of a test mining report


Here’s a guide on understanding various elements of a test mining or snapshot report. We will take example of the test mining report of an instance of Oracle Fusion's Payables process and understand its various elements. 

Start by opening the snapshot report from the Snapshot section of test discovery. 


This report is displaying mined scenarios extracted from the Oracle instance, providing a comprehensive overview of its testing process of payables module. 

It has three sections: Left, Middle, and Right. In the left panel, we have the list of all mined scenarios of the process.


At the top, we have a filter with five options. 


  • The Automated option shows the scenarios with automated test cases. 

  • Custom shows the scenarios we created or modified according to our needs. 

  • Mined, shows your as-is testing scenarios covered in your test plan. 

  • And, Suggested, shows the testing scenarios not covered in your test plan. These scenarios can be automated to increase testing coverage. Once automated, they will be reflected in the automated scenarios section.

  • The All option shows all the mined, suggested, and custom scenarios of your process


We have another filter to view closely related scenarios in a group.

  • Integration shows test scenarios associated with data transfer and integrations with other ERPs. 

  • Reporting shows test scenarios associated with generating reports for your Oracle workflows. For example, in payables process, this option may show scenarios associated with the trial balance report. 

  • Standard test scenarios cover the fundamental test cases of the process that users typically execute. 

  • Sanity test cases are like standard ones, covering most standard scenarios. They are prioritized for execution to verify basic functionality and identify access or other related issues. 


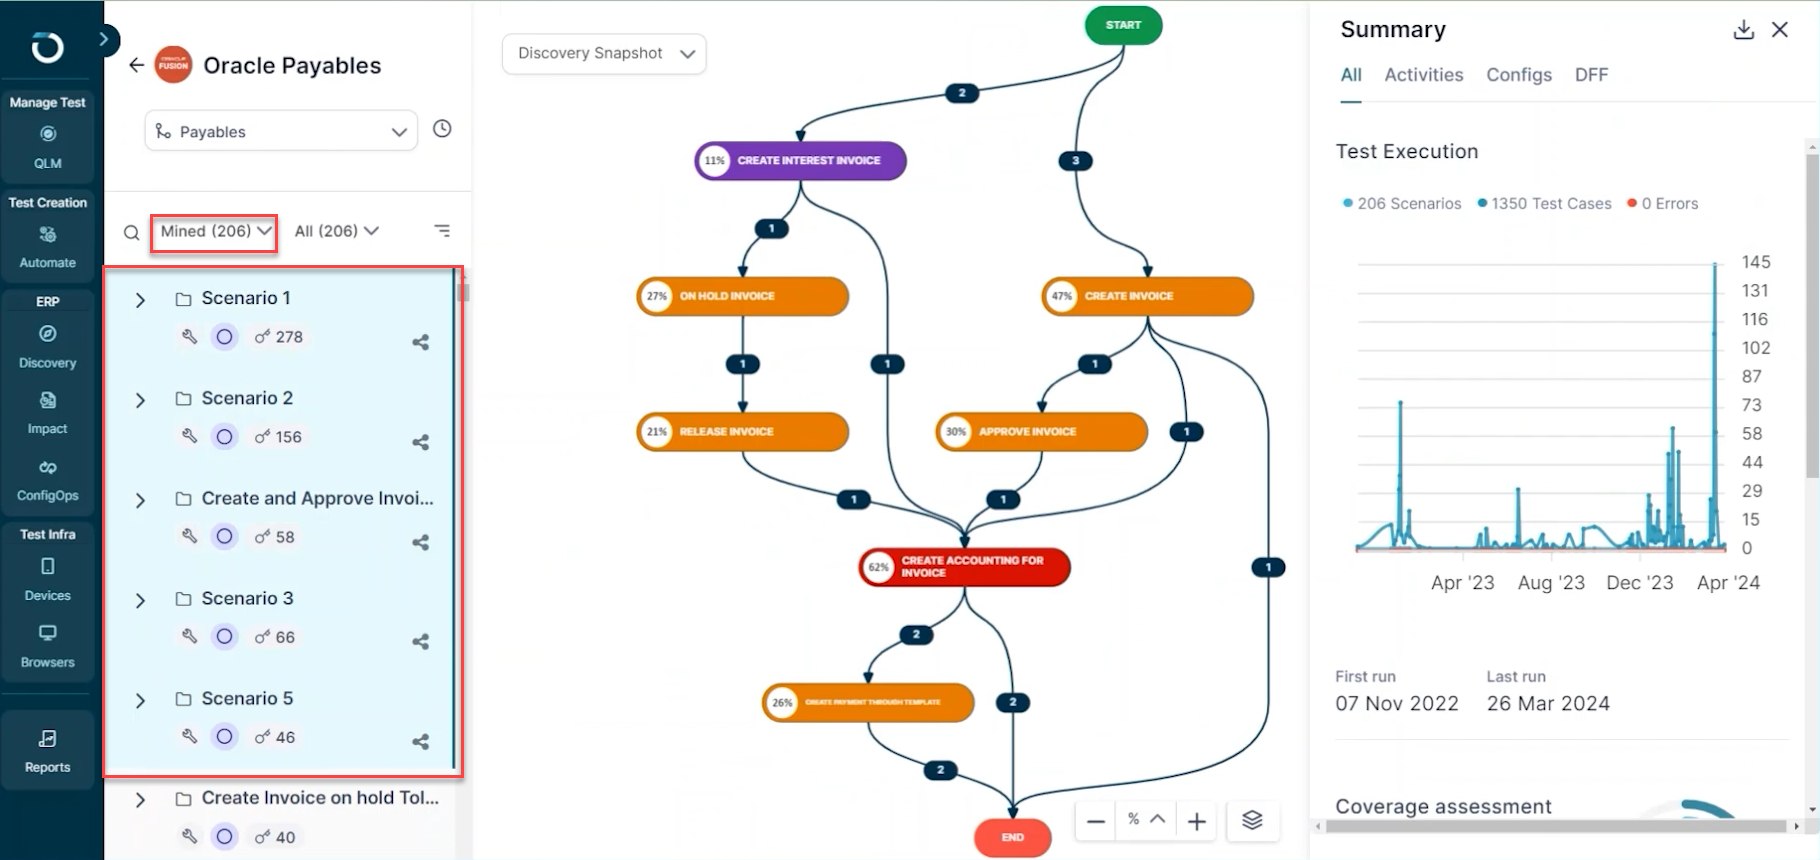
As you open the test mining report, five scenarios are selected by default. The flow of these scenarios is represented in the middle panel. You can select any from the left panel to view its flow in the middle panel.


Now, let's take a closer look at the visual representation of these scenarios. 


The box in the flowchart shows different activities involved in various scenarios.


The numbers on the arrows indicate how many scenarios include a particular activity.


For instance, the number four above the arrow on the "Create Invoice" means it is involved in four different scenarios depicted in the flowchart.


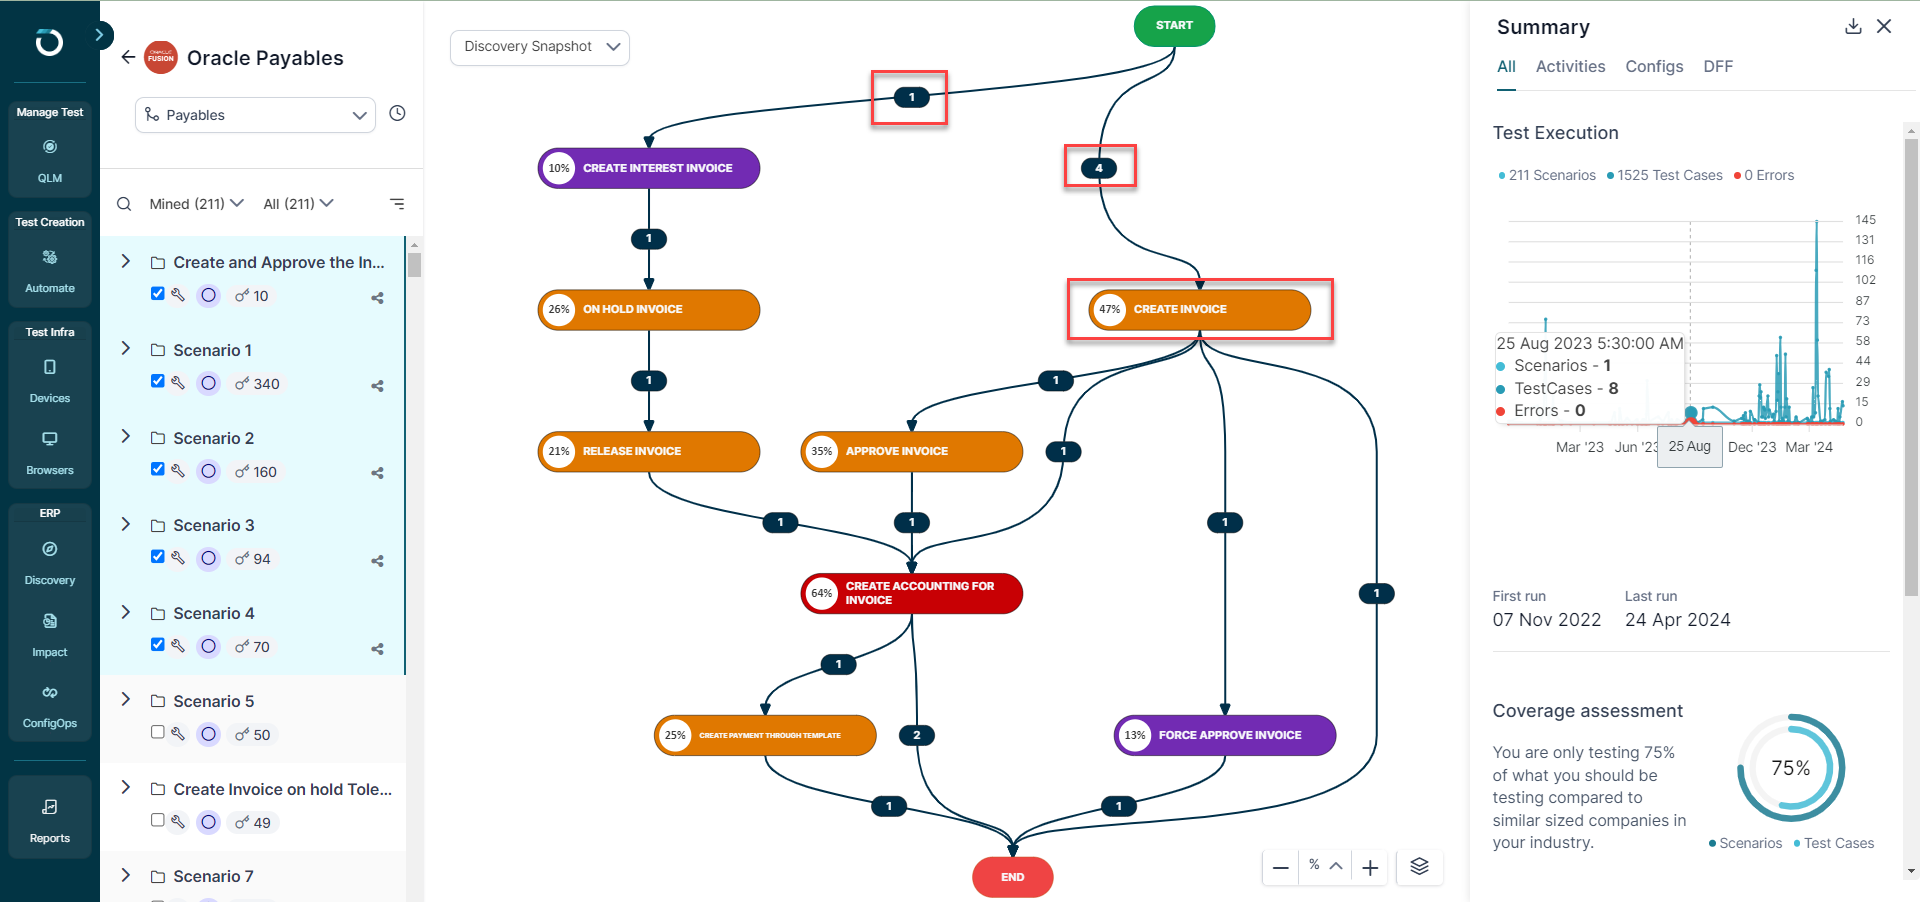
To make your analysis easier, Opkey color-codes activities based on their frequency of appearance in different scenarios.


For example, the orange color of the 'Create Invoice' activity indicates a medium frequency, indicating it appears in about 47% of the selected scenarios.


Medium-frequency activities range from 20 to 60% and are highlighted in orange. 


High-frequency activities, occurring between 61 to 100%, are coded red.


Low-frequency activities, ranging from 0 to 20%, are color-coded in purple.


With this information, you can prioritize testing high-frequency activities, which may impact multiple scenarios. 


Let's explore the right panel, which gives you the details of selected scenarios and test cases. Here, we can see your overall test coverage and the number of test executions done. We can select a scenario in the left panel to view its data, activities, and configurations on the right panel.


In the data tab, we can view details of mined data of a scenario. For example, the name of the business unit used for invoice creation.


Under the Activity tab, we can see the details of activities associated with this process. It shows the date and time of the activity and the name of the scenario that was modified.


The Config tab shows the configuration data of the selected scenarios, giving information related to both seeded and custom configurations.


Next, we have a DFF tab specific to the Oracle ERP instance. It shows mined details of the custom fields of your Oracle ERP process.


We have the option to automate a suggested or mined test scenario by clicking the Automate button in the Automate tab of a selected scenario. We can also automate a test case by clicking the automate icon at the top in the middle panel.


At the top, we have the option to download the Automation playbook or the Excel report of your mined instance. The playbook showcases all the discovered test and configuration analytics of your mined Oracle instance. It also explains the approach of testing best suited for your Oracle testing requirements.

The Excel report contains a list of your test scenarios and their test cases.

To read the related article on adding your ERP instance for test mining, click here

Was this article helpful?

That’s Great!

Thank you for your feedback

Sorry! We couldn't be helpful

Thank you for your feedback

Let us know how can we improve this article!

Select atleast one of the reasons
CAPTCHA verification is required.

Feedback sent

We appreciate your effort and will try to fix the article